Chasing Memory Leaks with Deleaker for Delphi
Contents
Introduction
Memory management is one of the most important topics in software development. There are many schools of thought around the topic and all share a common denominator: memory management is crucial for stable and efficient software especially if you develop on mobile platforms where resources are limited.
In Delphi, we are all very familiar with how proper memory management is done and millions of lines in blogs, texts and books have been written teaching proper techniques. However, development life takes its toll, software complexity skyrockets and we, very often, end up with code that leaks memory in an unpredictable or unintentional manner. Sometimes it is coding sloppiness, other times a matter of design; the bottom line is that every developer out there sooner or later faces memory leaks.
Chasing bugs is not my favorite moments in writing software. That’s why I am big fan of tools that help me focus on delivering value through coding rather than spending time in technicalities. It’s been a while now that I came across such a tool and in this post I am sharing my experience with Deleaker.
DeLeaker
Deleaker is a commercial profiler for C++, C#, .Net and Delphi developed and maintained by Softanics.
The Delphi version installs a component in the IDE (along with a version that provides a standalone profiler) and, whenever it is enabled, it gathers information about the resource allocation within a projects. It supports Console, VLC and FMX applications on Windows 32 and Windows 64 platforms.
Using Deleaker
Using the profiler is very straightforward. Once installed, you can enable it from a dedicated menu (Fig. 1) in the main menu bar in the IDE.
 Figure 1: Deleaker Menu
Then, you go ahead compiler and execute your project. When you close it, Deleaker kicks in and gathers information about the several objects your project has used. There are a few options to select which resources are shown according to your interests.
Finally, if there are leaks, you get a summary in a panel within the IDE (Fig. 2). Alternatively, you can use the standalone version of Deleaker to inspect your project outside the IDE.
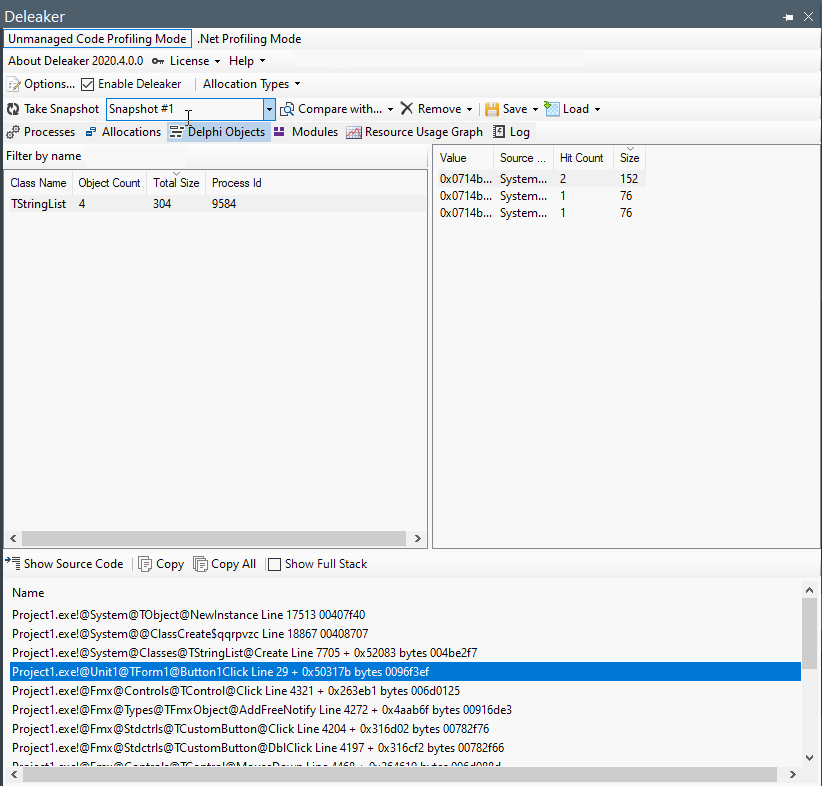 Figure 2: Deleaker Window
Of course, you can see where the leak occurred in the code, the lost amount of memory and how many times an object was instantiated (hit count).
Useful Features
There are a few things I find useful and handy in Deleaker.
Changes to the Source Code
The profile does not alter your code. In other solutions, you have to include specific units in specific order in your project to make it work and allow the memory manager to hook in your application. Here, the magic is done under the hood without any changes to your code
Filtering and Exporting
You can filter, export and save almost every view in the window
Snapshots
This is a very interesting feature. I mentioned before that Deleaker collects data after you close your application. This is not entirely true; You can grab a snapshot of the memory allocation at different stages of your application as it is being executed (run-time).
With the application open, switch to Deleaker’s window and hit the “Take Snapshot” button. Then, you can compare the different states of the application in terms of memory, objects, modules, etc. and decide what can be optimised and what can not
Resource Usage Graph
Another worth noticing feature; here you can see how memory consumption, handles and different objects change while you application is running. You can think of this graph as a live representation of snapshots for the whole execution time of your application (Fig. 3)
 Figure 3: Resource Usage Graph
Client API
Deleaker comes with a Client API. It is written in C++ and it can be used in Delphi to allow your applications to take snapshots of the memory allocations in run time as a means to provide debugging and resource logging functionality.
Conclusion
Deleaker is a relatively new player in the field of profiles for Delphi with some features I haven’t found in similar solutions; very straight forward to use with run-time resource monitoring and a client API. It is definitely worth having a look at. You can get a free trial version in the product’s website.